
Logs and metrics
Server log#
There is no log file. Application logs go to stdout, which means you read them the way you read any other service:
# systemd
journalctl -u semaphore.service -f

# Docker
docker logs -f my-semaphore-container
Verbosity is a CLI flag, --log-level DEBUG|INFO|WARN|ERROR|FATAL|PANIC, or SEMAPHORE_LOG_LEVEL. At DEBUG, narrow the firehose with --debug-filter, e.g. 'runner,task_*' or '*,-db'.
Activity log#
The activity log records what people did: adding and removing templates, inventories and repositories; adding and removing team members; starting and stopping tasks. It is visible per project in the UI, and stored in the database.
Writing it to a file (Pro 2.10+)#
Pro can also write activity and task logs to files — which is how you get them into an existing log pipeline:
{
  "log": {
    "events": {
      "enabled": true,
      "logger": { "filename": "./events.log" }
    },
    "tasks": {
      "enabled": true,
      "logger": { "filename": "./tasks.log" },
      "result_logger": { "filename": "./task_results.log" }
    }
  }
}
Each line looks like:
2024-01-03 12:00:34 user=234234 object=template action=delete
Event log options
| Parameter | Environment variable | Description |
|---|---|---|
enabled |
SEMAPHORE_EVENT_LOG_ENABLED |
Enable event logging to file |
format |
SEMAPHORE_EVENT_LOG_FORMAT |
raw or json |
logger |
SEMAPHORE_EVENT_LOG_LOGGER |
Logger options, below |
Task log options
| Parameter | Environment variable | Description |
|---|---|---|
enabled |
SEMAPHORE_TASK_LOG_ENABLED |
Enable task logging to file |
format |
SEMAPHORE_TASK_LOG_FORMAT |
raw or json |
logger |
SEMAPHORE_TASK_LOG_LOGGER |
Logger options, below |
result_logger |
SEMAPHORE_TASK_RESULT_LOGGER |
Logger options for task results |
Logger options (rotation, shared by all of the above)
| Parameter | Type | Description |
|---|---|---|
filename |
String | Path to write to. Rotated files stay in the same directory. Defaults to processname-lumberjack.log in the temp directory |
maxsize |
Integer | Megabytes before rotation. Default 100 |
maxage |
Integer | Days to retain rotated files. Default: keep forever |
maxbackups |
Integer | Number of rotated files to keep. Default: keep all |
localtime |
Boolean | Timestamp rotated filenames in local time instead of UTC |
compress |
Boolean | Gzip rotated files. Default false |
Use json format if anything downstream is going to parse these.
Task history and retention#
Task execution is stored in the database and browsable in the UI, live or historically.
Retention is unlimited by default. On a busy instance that is a slow-motion disk problem. Cap it per template:
SEMAPHORE_MAX_TASKS_PER_TEMPLATE=30{ "max_tasks_per_template": 30 }When a template exceeds the limit, the oldest task logs are deleted. If you need history beyond that, ship it out (file collector, syslog or the audit webhook) before it rotates away.
Syslog forwarding#
Activity and task entries can be forwarded to an external syslog collector. Off by default.
{
  "syslog": {
    "enabled": true,
    "network": "udp",
    "address": "logs.example.com:514",
    "tag": "semaphore"
  }
}| Parameter | Environment variable | Description |
|---|---|---|
enabled |
SEMAPHORE_SYSLOG_ENABLED |
Turn forwarding on or off |
network |
SEMAPHORE_SYSLOG_NETWORK |
udp or tcp |
address |
SEMAPHORE_SYSLOG_ADDRESS |
Collector in host:port form |
tag |
SEMAPHORE_SYSLOG_TAG |
Identifier prepended to every message |
Restart Semaphore after changing these.
SIEM integration#
From 2.20, Semaphore records a security audit trail suitable for Splunk, Elastic Security, QRadar, Wazuh and similar.
Every audit event carries the action (create, update, delete, login_success, login_fail, logout), the client IP and the user agent, alongside the acting user and the affected object. Beyond resource changes it logs:
- successful logins (password, LDAP, OpenID), logouts, failed logins and failed MFA verifications
- user account creation, update, deletion and password changes
- API token creation and deletion — only the short token prefix, never the secret
Three delivery routes:
- Pull — read
/api/events. See the REST API. - File collector — enable the activity log file (Pro) in
jsonformat and ship it with Filebeat, Fluentd or a Splunk Universal Forwarder. - Audit webhook (Pro) — push events over HTTPS in real time.
Audit webhook#
{
  "log": {
    "audit_webhook": {
      "enabled": true,
      "url": "https://splunk.example.com:8088/services/collector/event",
      "format": "splunk_hec",
      "headers": {
        "Authorization": "Splunk <your-hec-token>"
      }
    }
  }
}| Parameter | Environment variable | Description |
|---|---|---|
enabled |
SEMAPHORE_AUDIT_WEBHOOK_ENABLED |
Turn forwarding on or off |
url |
SEMAPHORE_AUDIT_WEBHOOK_URL |
Receiver endpoint |
format |
SEMAPHORE_AUDIT_WEBHOOK_FORMAT |
Empty for plain JSON, or splunk_hec |
headers |
SEMAPHORE_AUDIT_WEBHOOK_HEADERS |
Extra HTTP headers, e.g. the HEC token |
Delivery is asynchronous: events queue in memory and retry up to three times with backoff, so a slow receiver never slows down a user request. If the receiver stays down, queued events are dropped with a warning in the server log — so alert on that warning if the audit trail is a compliance requirement.
Prometheus metrics#
The metrics endpoint is available from Semaphore 2.20.
Semaphore exposes GET /api/metrics in the Prometheus text format, so an existing Prometheus and Grafana stack can monitor it with no extra exporter.
Process metrics — Go runtime and process stats: goroutines, heap and resident memory, CPU time, GC pauses.
Task metrics — Semaphore's own workload:
| Metric | Type | Meaning |
|---|---|---|
semaphore_tasks_running |
Gauge | Tasks running right now |
semaphore_tasks_total{status} |
Counter | Finished tasks by outcome: success, error, stopped |
Both update in real time — the counters are incremented inside the task runner as status changes, not sampled on a timer.
Enabling it#
The endpoint is disabled by default and requires HTTP Basic Auth with a static service credential, because Prometheus cannot do an interactive login:
{
  "metrics": {
    "enabled": true,
    "username": "prometheus",
    "password": "changeme"
  }
}| Parameter | Environment variable | Description |
|---|---|---|
enabled |
SEMAPHORE_METRICS_ENABLED |
Turn /api/metrics on. Off by default |
username |
SEMAPHORE_METRICS_USERNAME |
Basic Auth username |
password |
SEMAPHORE_METRICS_PASSWORD |
Basic Auth password |
With enabled false, or credentials missing or wrong, every request returns 401 Unauthorized.
Scraping#
scrape_configs:
  - job_name: semaphore
    metrics_path: /api/metrics
    basic_auth:
      username: prometheus
      password: changeme
    static_configs:
      - targets: ["<semaphore-host>:3000"]
In Grafana#
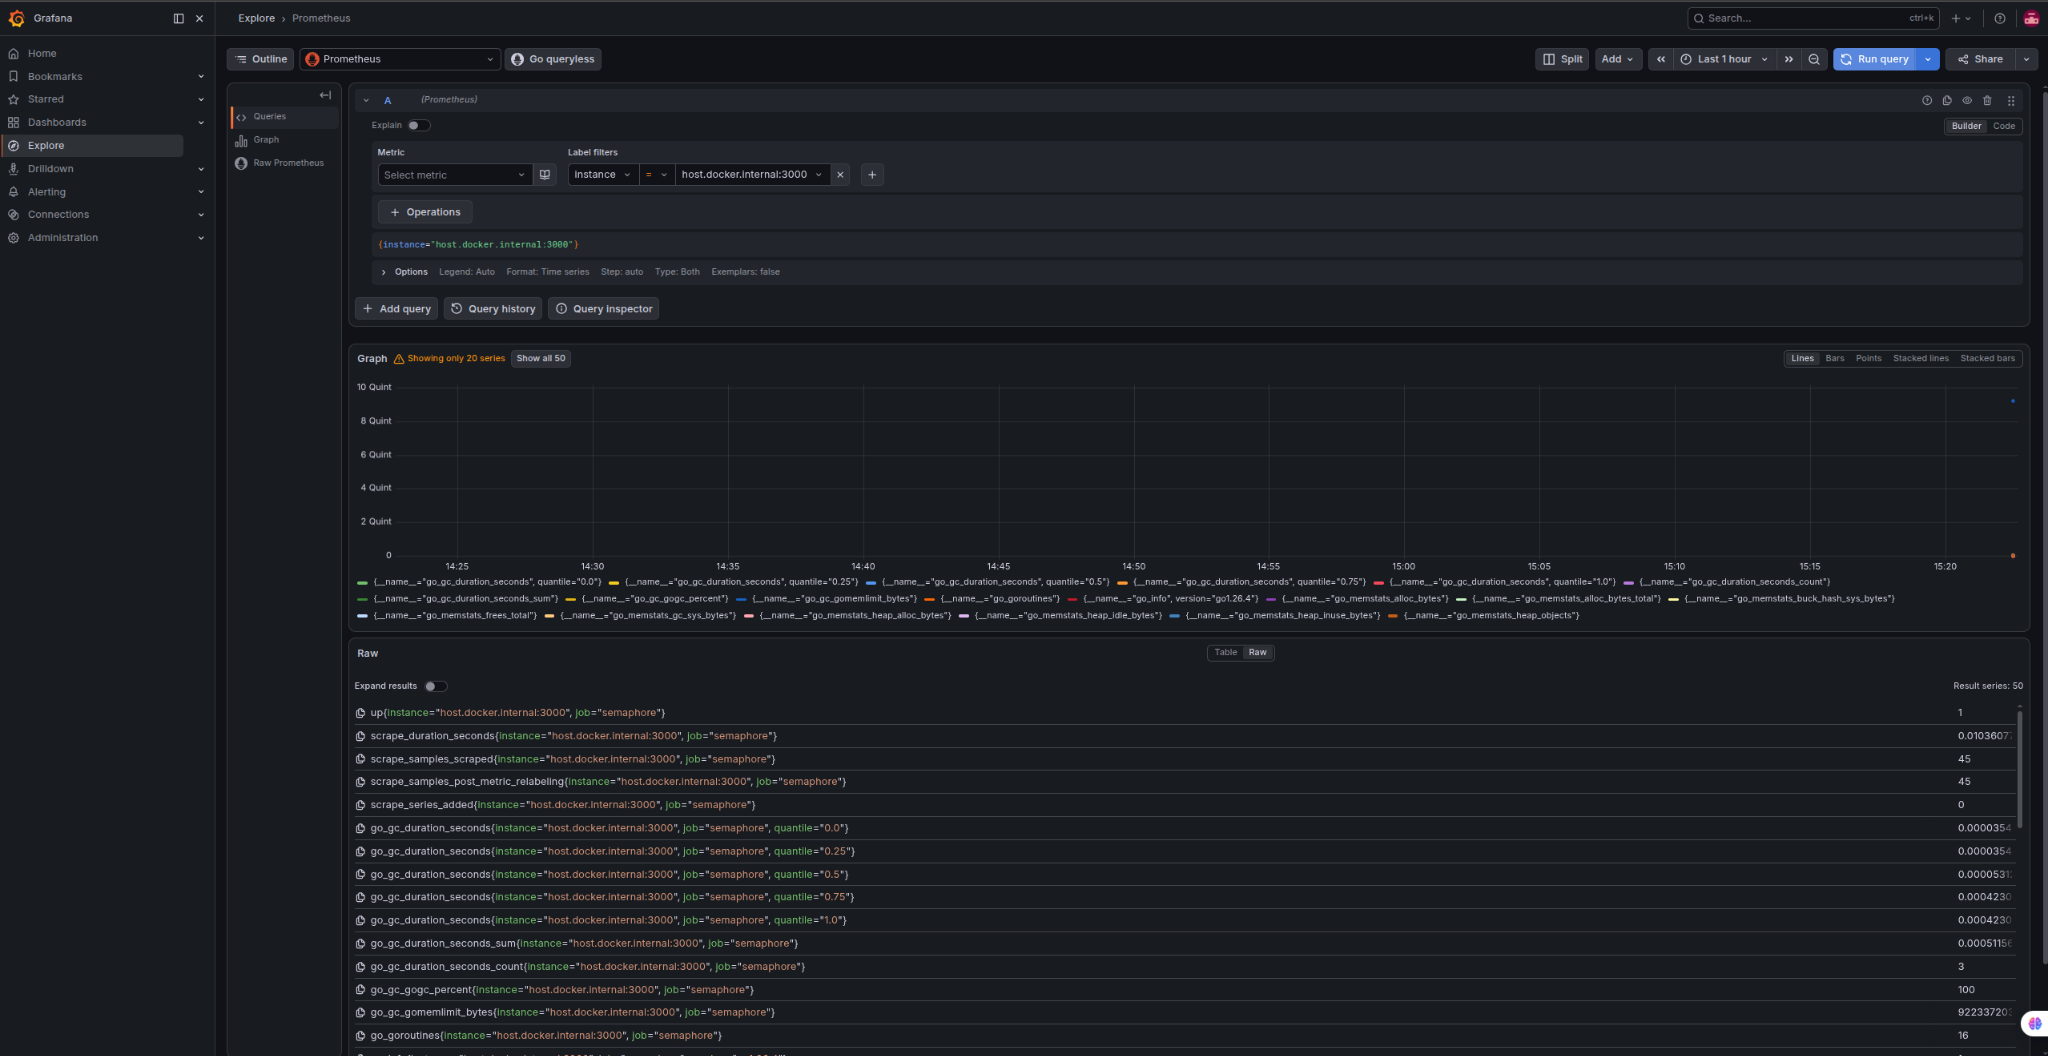
Grafana's Explore view runs PromQL against the metrics without building a dashboard first:
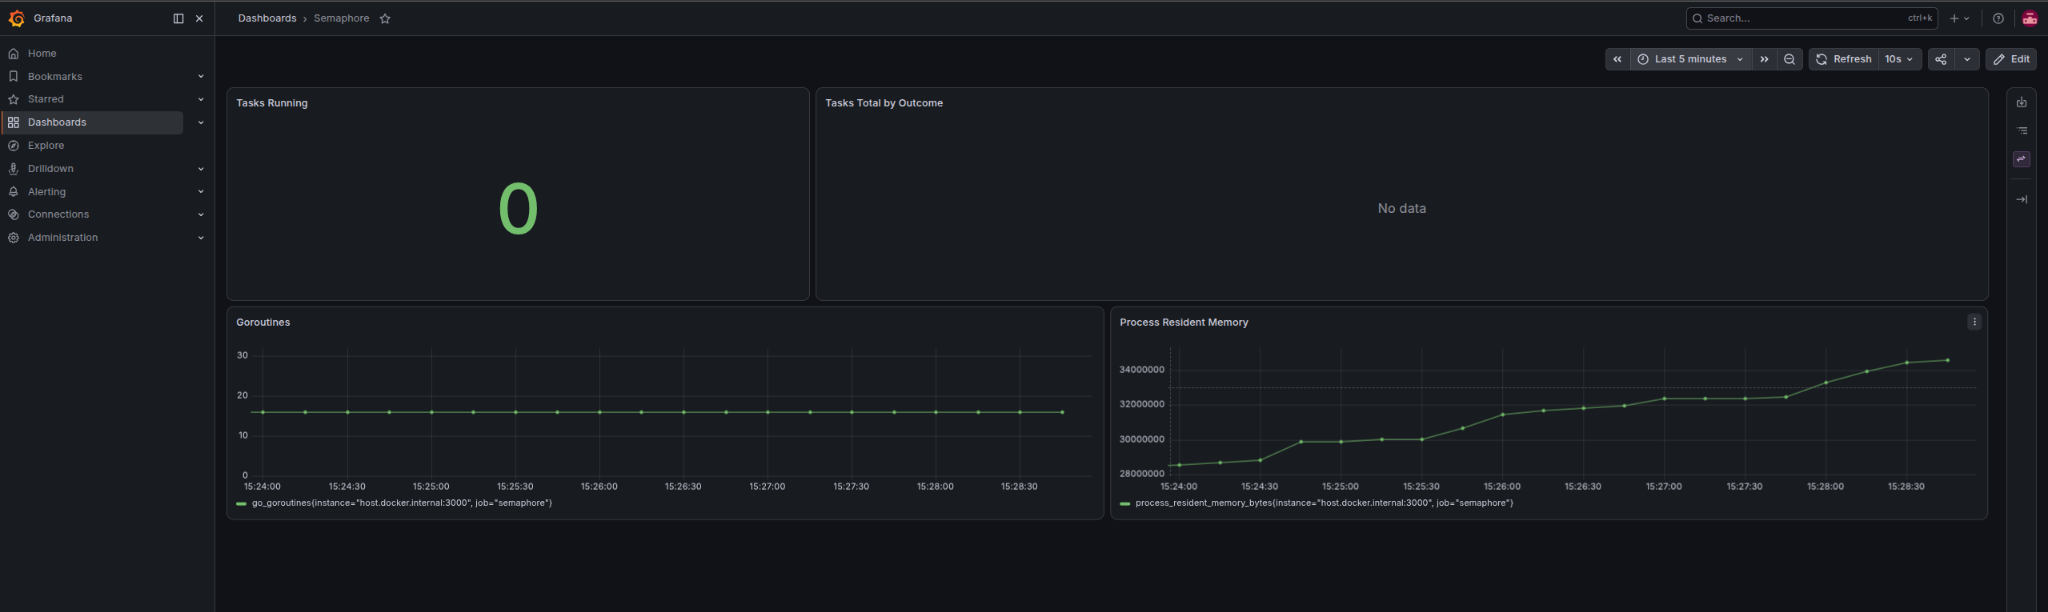
A dashboard on top of the same metrics — tasks running, tasks by outcome, goroutines, resident memory — covers both categories in four panels:
Next steps#
- Security — what the audit trail is protecting
- High availability — monitoring a cluster
- REST API — pulling events programmatically